How I do research
A behind-the-scenes look at my research on social media use and teen mental health
Welcome to Techno Sapiens! Subscribe to join thousands of other readers and get research-backed tips for living and parenting in the digital age.
8 min read
When we hear about psychology research, it’s often distilled down to its simplest form. A sentence in an Atlantic article stating researchers have found that X is linked with Y. A book with a single-word title like Blink, Quiet, or Grit. A newsletter1 briefly alluding to a recent meta-analysis on babies and screen time.
By the time we read about a research study, it’s over. The data has been collected, analyzed, and interpreted. We have the findings and, when they’re packaged in a nice little article on behavior change techniques, it all seems so simple. We have a question, we do a study, we arrive at an answer. Science!
But a 10,000-foot view of a research study misses some important details.
It misses everything that comes before the research. The 8 months of panicked, late-night writing sessions, putting together a grant application to the National Institute of Mental Health. The tears, the sweaty palms, the saintly advisor reading drafts mere hours before the deadline. The 36-hour trip to Montreal for a friend’s wedding, in which you spent approximately 30 hours on your laptop. The year of waiting for news on the application you submitted.
The popular version of psychology research also misses that science is, frankly, a little boring sometimes. It misses the day-to-day monotony of emailing your IT guy to ask whether certain software is HIPAA-compliant. Of combing through 3,000 spreadsheet rows of eye-tracking data to check for accuracy. Of fiddling, over and over, with the decimal tab setting in Microsoft Word tables.2
It misses that the path to answers is not always linear, that problems and frustrations are inevitable. That the day-to-day of running a study involves surprisingly little Eureka! and surprisingly frequent Oh no. You can’t get your eye-tracking program to run. Instagram, a platform you’re studying, suddenly overhauls its user interface. Your study clinician calls in sick. Your participants stop answering calls.
It misses the moment when your data analyst sends you a visual depiction of your participant’s eye-tracking data for the first time. The eye-tracking software was designed to use participants’ webcams to record where their eyes are looking on their screens—but you’ve been wondering if it’s doing what it’s supposed to. As you glance at the animation, hundreds of tiny blue dots appearing sequentially on the screen to represent the teen’s eye position every 50 milliseconds, you realize your experiment is working. That it might actually make a difference.
When we take a 10,000-foot view of the research, we miss the 5-foot, 7-inch view3. The view from the people doing the research, day-to-day. As we look closer, we can start to see the late-night grant writing sessions, and the spreadsheets, and those godforsaken Microsoft Word tables—and that, through it all, science can still be fascinating.
A 5-foot, 7-inch view of a research study
Every researcher lives with the secret hope that someone will, one day, ask them to describe in detail the methods of one of their research studies.
How’s your research going? Our imaginal conversation partner asks.
It’s going well! We respond.
Great, they follow-up. Could you just give me a detailed rundown of your study protocol, including recruitment procedures, experimental timing, and analytic plans?
This doesn’t usually happen in everyday conversation. Probably one reason academics love to go to conferences.
All this to say, I am excited to spend the rest of this post sharing the details of a study I’m currently running—a 5-year project funded by the National Institute of Mental Health. I will try not to get too in the weeds—just a dandelion or two—but if research methods really aren’t your thing, I get it. I won’t be offended if you skip to the footnotes.
What the study is about
In the U.S., nearly 1 in 3 teens report persistent feelings of sadness or hopelessness, and 1 in 5 teens report that they “seriously considered” suicide in the past year. At the same time, 97% of teens use social media, and we know that for some of those teens, their social media use is having a negative effect on their mental health.
So, the goal of this study is to understand which teens are most vulnerable to the negative effects of social media and why.
More specifically, we’re asking questions like:
Will teens who show certain patterns of behavior on social media (e.g., posting or viewing more negative content) show worsening mental health symptoms over time?
Will teens who are more sensitive to the positive and negative feedback they get from their peers on social media show worsening mental health symptoms over time?
My hope is that, if we can identify those kids and why they’re struggling when they use social media, we can develop interventions to help them use (or not use) social media in healthier ways.
How the study works
Recruitment
For this study, we’re working with a higher risk population of teens who are already struggling with their mental health—specifically, teens who have some history of suicidal thoughts. We4 recruit these participants by contacting families whose teens may be eligible. We find these families via a range of sources: nearby hospitals, Facebook ads, schools, etc.
We get on a Zoom call with them, explain the study, and if they decide they want to participate, they sign up (with parental permission). Note that we go to great lengths to make sure the study and our participants are safe—this includes a full (very thorough) review by the hospital’s research board of ethics.
Why do you do this? We’re recruiting this higher-risk sample of teens because we need to do a better job understanding and supporting this population. In addition, by oversampling for teens with existing mental health concerns (i.e., recruiting more of these teens than would naturally occur in the population as a whole), the outcomes we are looking for (mental health symptoms) will occur with enough frequency to do analyses.
Study timing
Over the course of one year, we meet with the teens over Zoom three times: a “baseline” session, a 6-month follow-up session, and a 12-month follow-up session. During these sessions, we do a series of activities, described below.
Why do you do this? By checking back in with participants 6 and 12 months after their first session, we can track how their symptoms have changed. Eventually, this will allow us to do “longitudinal” analyses, seeing whether their social media use at baseline “predicts” their mental health symptoms getting better or worse over time.
Experiment with eye-tracking
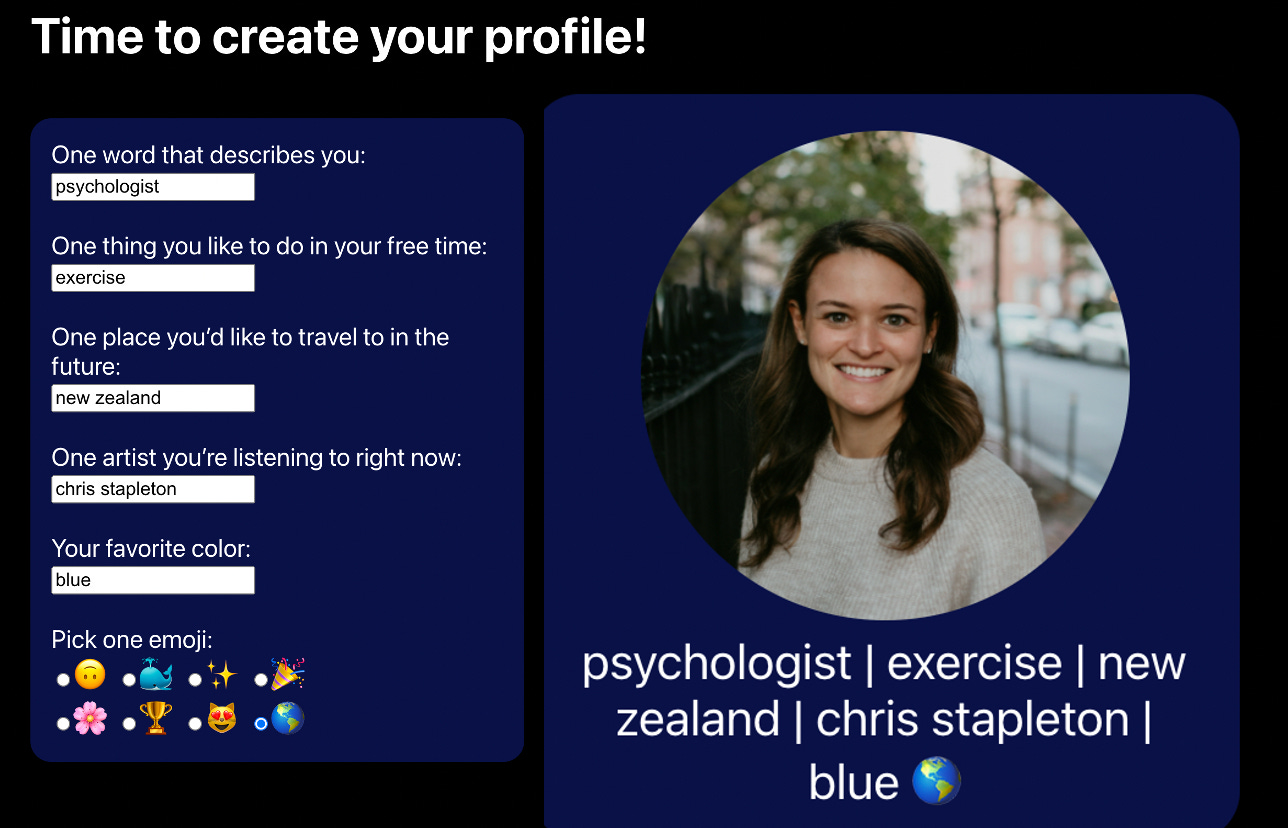
The most important part of the study is a 30-minute experiment where participants use an Instagram-like website we designed. During this experiment, they think they are interacting live with other teens, when, in fact, it is all pre-programmed (no other real teens are participating).
Our participants create a “profile” (with a photo and “bio”). Then, they get “feedback” from the (fake) other teens in the form of numerical ratings (similar to Instagram “likes” and other online social feedback). Every so often during the experiment, our teen participants report how they’re feeling, rating words like “rejected,” “accepted,” “happy,” and “embarrassed” on a scale of 0 to 100.
While all this is happening, we are also using eye-tracking through their computers’ webcams to see where they are looking on the screen.
Right after they finish the experiment, we thoroughly debrief them. We check to see if they had any suspicion that the task was rigged—some do, most do not—and then we explain to them that it was fake.
Why do you do this? Using both the eye-tracking data and the feelings ratings, we will be able to get a sense of how teens respond after they get positive or negative feedback from other people on social media. Then, we’ll be able to test whether certain patterns of responses are associated with more risk for mental health symptoms later on.
For example, we can see where teens tend to focus their attention on the screen. Some prior studies have shown that when teens feel rejected, they look away from photos of themselves (perhaps out of embarrassment) and toward photos of their peers. The question is: are the teens who don’t follow that visual attention pattern at higher risk when they use social media? When a teen doesn’t get enough likes on a photo of themselves, and then they fixate on that photo, does that make their social media use more problematic in the long run?
Social media data downloads
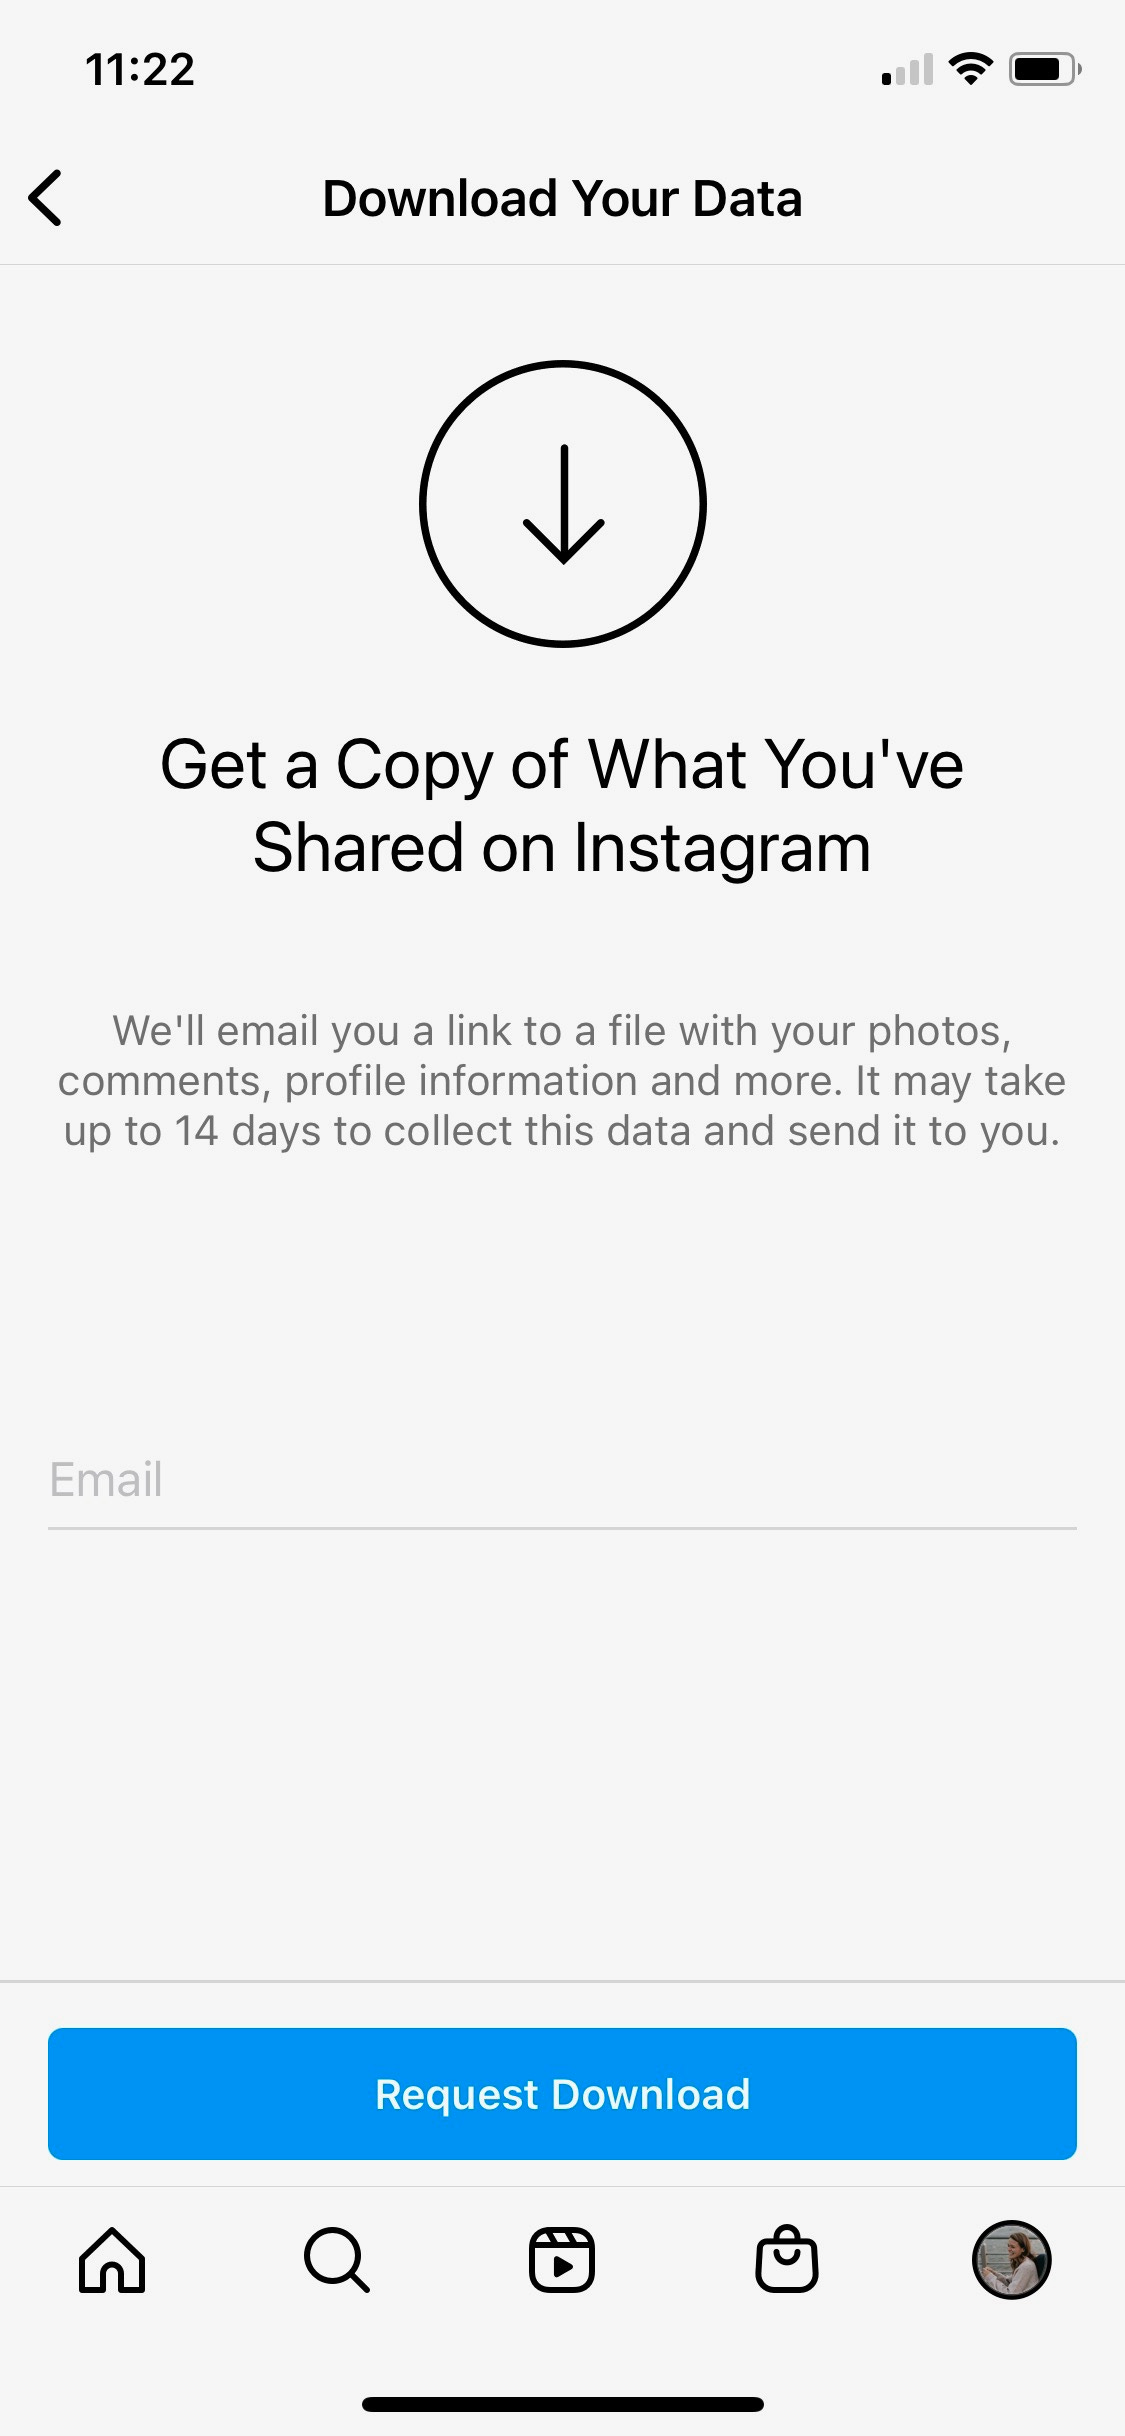
Participants download their social media data and share it with us. This includes their posts, comments, and other activity on Instagram, Snapchat, TikTok, and Facebook (if they have it, which is, unsurprisingly, rare). Anyone can do this from their social media accounts—here’s how to do it on Instagram, if you’re curious. We then run the data through a computer program that removes all identifying details and organizes it so that we can analyze it later using machine learning.
Why do you do this? By looking at the things teens are actually doing on social media—the language they’re using, the types of photos they’re posting—we can determine whether certain patterns of social media use are associated with worse mental health outcomes.
Clinical interviews
Participants complete a few “clinical interviews” with me or another clinician. We use standardized interview measures to ask them about their symptoms of depression and any past or recent suicidal thoughts or behavior. Note: if, based on this interview, we are worried about their current safety, we talk to their parent and make a plan to ensure they are safe.
Why do you do this? Clinical interviews, conducted by trained mental health professionals, are a valid way to learn more about people’s symptoms. We will use the information we get from these interviews when we want to test whether a certain type of social media use is associated with changes in their symptoms over time.
Self-report questionnaires
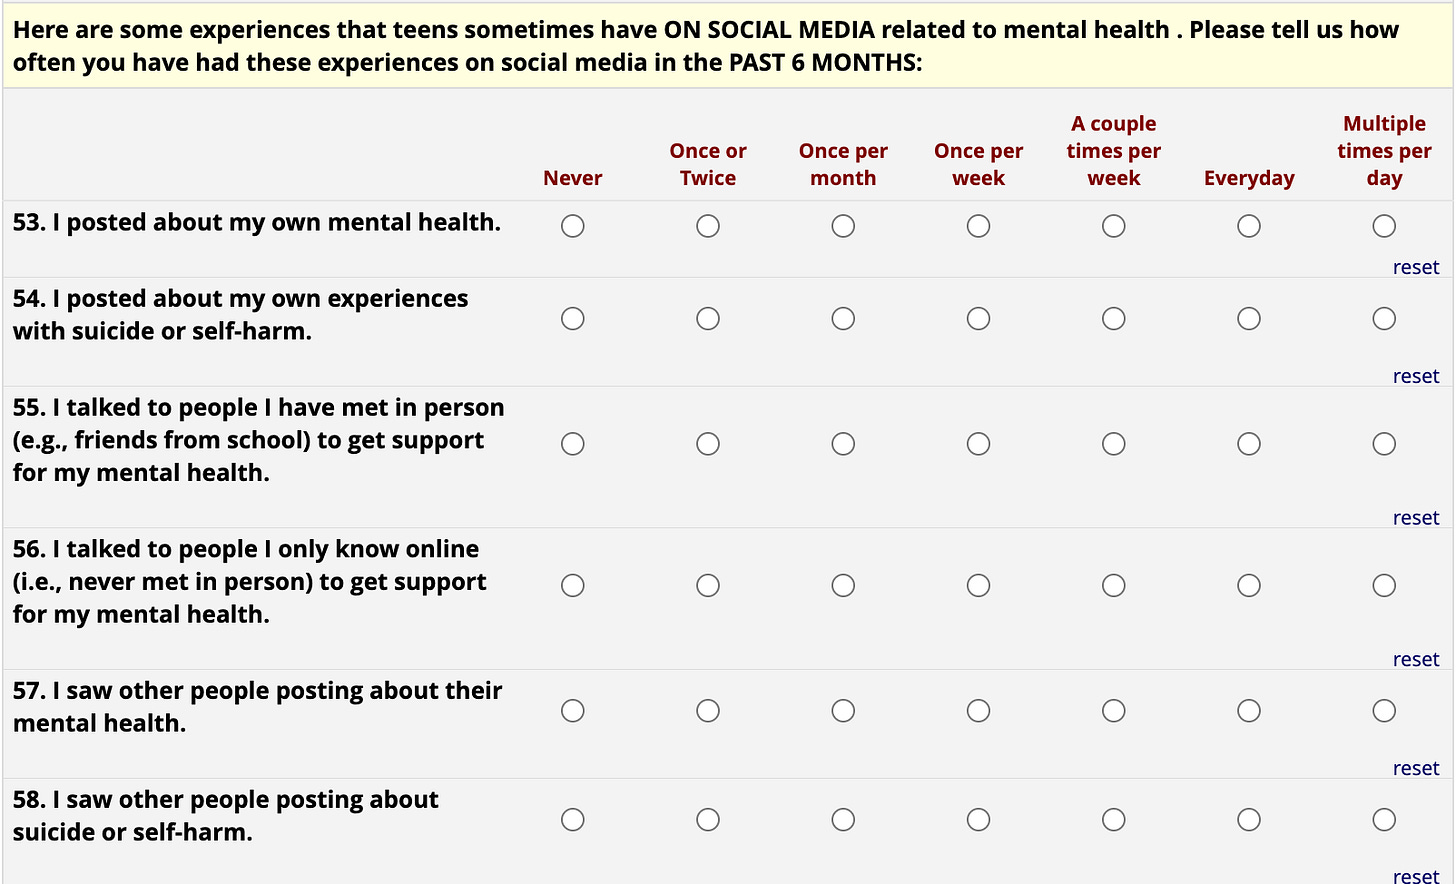
Our participants answer a number of questionnaires online. These include questions about mental health symptoms, social relationships, and lots of details about how they use social media.
Why do you do this? Although self-report measures can sometimes be biased (people are not always great reporters of what they’re experiencing), these types of measures are essential to psychology research. There are many experiences people have—thoughts, feelings, social media behaviors that won’t get captured in our data downloads—that are really difficult to understand in other ways. We’ll use these measures to supplement the other information we’re gathering about their social media use and mental health symptoms.
What’s next?
We plan to enroll about 100 participants, and we’re just about halfway there. Once we’re done, we’ll analyze the data from each of these sources (the experiment, social media data downloads, questionnaires, and clinical interview). We’ll write up our results, publish our findings, and start writing the next grant application5.
And we’ll hope to find some answers along the way.
A quick survey
What did you think of this week’s Techno Sapiens? Your feedback helps me make this better. Thanks!
The Best | Great | Good | Meh | The Worst
In case you missed it
Do I talk about meta-analyses too much? Substack allows you to search any newsletter’s archive for a given word or phrase so, naturally, I searched my archive for “meta-analysis.” A lot of posts showed up. Like, one-third of all posts I’ve ever written. Techno sapiens—have I been going on and on about meta-analyses, and you’ve all been too polite to tell me to stop? This is a food-in-teeth situation. If this is happening, please, you need to tell me and spare us all the embarrassment.
But actually, have any of you ever tried to make a table in Microsoft Word? More to the point, have any of you ever successfully made a table in Word without muttering obscenities under your breath? On more than one occasion, I’ve considered quitting my job over a Word table. Just closing the laptop, setting it briefly on fire, and walking away from everything. Decimal aligning will be the end of me.
Yes, it’s me. I’m 5-feet, 7-inches. For those wondering, I’ve been this height since I was 11 years old. Fifth grade was a rough year.
When I say “we,” I’m referring mostly to my team of research assistants (RAs). A little known fact about psychology research studies is that most studies are run primarily by post-bacc RAs—recent college graduates who dedicate their time, for minimal pay (by necessity of the budget for these grants), to tasks like calling hard-to-reach participants and checking social media data by hand to ensure it’s been properly de-identified. If RAs were to stop doing their jobs, the entire scientific enterprise would fall apart. RAs: we appreciate you.
To clarify, when I say “start writing the next grant application,” I mean that I’m already starting to write the next grant application. But wait, you ask, didn’t you say you’re only halfway done with the current study? This is a logical point, but academic funding does not operate in the realm of logic. Most grants take at least a year and a half from the time the application is submitted to the time they’re funded. Oh, also, less than 1 in 5 of them are actually funded. Science!


I liked this one ... though I’ll admit to skimming in the methodologies deep dive. That’s okay, I got the jist.